
Accelerating Doubled Haploid Plant Production
How impedance flow cytometry can help you significantly increase the efficiency of microspore culture.
Introduction

Dr. Federica Assenza
Hello Pollen Experts, this is Federica. For almost 2 years I have been working at Amphasys in the Customer Support and Consulting team. Before joining Amphasys I spent many years in the lab, busy with in planta, protoplasts, or purely molecular assays. Since I started visiting our customers, I have met those who use our technology for the development of haploid plants. They need to spend a substantial amount of time in optimizing methods, just like I had to in my old days in the lab. But they seem to have found a shorter path to the goal. Thus, I decided to share also with you all a few ways in which impedance flow cytometry can come in handy for the analysis of microspores, in the hope that your experiments will accelerate.
What this Article is About
Doubled haploid (DH) plants are nowadays a widespread tool in plant breeding, genetic research, and biotechnology. However, many scientists are still waiting to see their favorite species or even genotype produce a doubled haploid individual. Unfortunately, there is no universal protocol, instead much finetuning is required at all the steps of the process from the gamete – male or female – to the diploidized plant.
In this article I am going to discuss a few ways in which impedance flow cytometry (IFC) can ease the obtainment of DHs via the androgenic pathway. I will show you how the results obtained with the Ampha Z40 Pollen Analyzer can be used to:
- generate an IFC map of microspore development. This can be used to optimize the selection of buds or anthers and maximize the proportion of microspores at the right developmental stage for successful induction of embryo development;
- determine microspore viability at the start and throughout culture;
- estimate microspore density;
- observe the response to the induction and culture conditions and early predict the efficiency of embryo formation.
Subscribe to our blog!
If you want to make sure to be informed about new articles, subscribe to our blog!
The Plasticity of Plants and How DHs Come to Exist
To me haploid plants are one of the neatest embodiments of the “green kingdom” plasticity. First, a cell type can change its developmental fate and become something it was not programmed to be. This happens to the gametic cells, either the microspore – precursor of pollen – or to the immature egg cell.
By the plan, the pollen grain and the egg cell – both haploid – would fuse to form an embryo. A wannabe new plant, with a diploid chromosomic set, thanks to the equal contribution of both gametes. However, under specific stress conditions, the plot of the story can change, and one of the gametes can form an embryo alone. A haploid embryo! Second marvel: from the haploid embryo a new plant can develop, even with just half of the chromosomes! This whole process is called gametophytic embryogenesis: androgenesis if the embryo originates from a microspore, gynogenesis if it comes from an egg cell.
But this is not the end of the story. If it has not happened spontaneously, at an early stage in the life of the haploid plant, one of its organs can be treated with so-called diploidizing agents. These molecules interfere with DNA duplication and cell division, thereby creating diploid cells [1]. Some of the newly formed diploid cells will give rise to the reproductive organs of the plant and diploid seeds will be generated. The diploid plants that germinate from those seeds are doubled haploids, i.e. their genome is twice the copy of the initial microspore’s genome, and perfectly homozygous

Pepper microspores under the microscope
The homozygosity of DH plants is what makes them so popular among plant breeders. In the DH plant an advantageous combination of traits can be “frozen” so that no recombination will get on the way and pull apart haplotypes so long wished for. Also, geneticists use DHs as tools, as the homozygosity reveals the effect of recessive genes straight away. These are just a couple of the numerous applications of DH plants.
Oh, How I Wished My Protocol Worked...
Many wish to work with DHs, but their production is difficult. It can take years of protocol refinement before isolating the first haploid plants [2]. For most crops DHs are obtained through microspore embryogenesis [3]. Many factors contribute to the success, from the growth condition of the donor plants to the microspore isolation method, from the embryogenesis inducing stress treatment to the composition of the culture medium. Even though protocols for the generation of DHs exist for many species, the conditions that are suitable for one species, or even one genotype, may not work for another. Thus, it pays off to broaden the number of treatments tested to pinpoint the combination that works for your material. You may now think for yourself: “Easy said. What about the time that it takes to test all combinations of conditions?”. If you did think so, I feel you. I did often too during my research years when trying to optimize an in vitro assay. Often the problem is that the readout of the experiment is tedious to obtain, or that you need to let the experiment run for many days, only to realize at the end that the results are not what you had hoped for.
But what if there were a technology that could simplify the way you assess whether the experiment is taking the right turn and staying on track? Let’s have a look at how Amphasys’ technology can help you.

A Map of the Microspore Developmental Stages
One of the endogenous factors that seem to be of eminent importance for the successful production of microspores-derived embryos is the developmental stage of the microspore used as starting material. The switch from pollen to embryo development works efficiently only around the first pollen mitosis, between vacuolate microspore and binuclear pollen [3]. Therefore, it is crucial to start the culture with the highest proportion of the most suitable cells to increase the chances of success in the steps downstream.
Commonly, the selection of the starting material is done by correlating the size of the flower bud or the spike, to the microspore stage assessed by microscopy. Microspores are stained with DAPI or acetocarmine and the proportion of cells at the different stages is counted based on the number of nuclei and the cell morphology, both very dynamic during this development.
Intriguingly, microspores at different developmental stages respond differently when interrogated by an alternating current, as during a measurement with the Ampha Z40, due to their specific volume, cytoplasmic and membrane characteristics [4]. The generated signals allow to visualize one stage as a distinct population in the scatterplots. Here is an example obtained with wheat (Figure 1). We isolated microspores in our AF6 buffer from anthers of single spikelets. We took a fraction of the volume to stain the cells with DAPI and, after filtration and dilution, we measured the rest with the Ampha Z32. Spikelet after spikelet here it is, the microspore developmental pathway unfolding before our eyes in the form of overlaid scatterplots and corresponding DAPI micrographs!

Figure 1: Overlay of scatterplots of wheat microspores and corresponding micrograph of DAPI stained cells
The remarkable thing is that the position of the cloud corresponding to a given developmental stage is quite consistent, across several species we tested, in relation to the position of the clouds corresponding to the other developmental stages, as you can see in Figure 2.

Figure 2: Here you see an overlay of scatterplots of microspores at different developmental stages. To each scatterplot a different color was associated to approximate the cells’ developmental stage
Now, getting back to your staging experiment. You may use the Ampha Z40 in the same way with your species of interest. With your first experiment you will assess by microscopy which developmental stage(s) are present in a single sample. You will run the same samples with the Ampha Z32 and see where the clouds corresponding to the observed developmental stages appear in the scatterplot.
Comparing the results obtained with the two methods you will be able to assign a position in the scatterplot to a developmental stage. Furthermore, using the data analysis tools of AmphaSoft (polygon gate), you can quantify the abundance of each population. And in turn assign the proportion of a given stage to the bud size or position of spikelet in the spike, as we did in Figure 3. For certain species, those shedding pollen as trinuclear, you will see overall more populations than in the species where pollen is shed as binuclear.
Now you know which buds or spikelets to go after and avoid spending time on harvesting and dissecting the wrong material. With this experiment, you have created your reference system, your map of developmental stages on a scatterplot. I encourage you to create your own map, one that includes all developmental stages from the very early microspores to mature pollen.
When analyzing a new batch of buds of the same genotype you can apply the same gates and estimate in a few clicks the developmental stage of your new samples, without repeating tedious staining assays.

Figure 3: Proportion of uninucleate, binucleate and trinucleate microspores along a wheat spike.
Genetic variation may have an effect on the size of the microspores and therefore the amplitude in the IFC plots. Therefore, working with the same gates for all genotypes may not be suitable. This is because at the very early and at the late stages of development the uninucleate microspore and the early pollen have comparable phase angles.
However, we have seen that the evolution of both the phase angle and amplitude, i. e. the transition from one position on the scatterplot to another, robustly associates with the developmental stage across genotypes. Therefore, by analyzing a series of buds of increasing size, and not just a single size, you can deduce the developmental stage of each sample. You need to evaluate the position of the cloud of an individual sample in relation to the position of that of a smaller or larger bud in the series and compare it to your previously generated “scatterplot map”.
Estimate Microspore Viability and Density
Once you know which starting material to use, the next step is how to isolate the microspores so that the extraction is efficient in terms of hands-on effort, number of collected cells per input unit and their viability. To verify the microspore density and viability, the conventional protocols rely on two microscopy assays: a viability staining, such as FDA, and cell count in an hemacytometer. The Ampha Z40 can give you both parameters in a single measurement. Let me explain how.
Impedance Flow Cytometry (IFC) is used to assess cell viability for a number of applications. The measurement is based on membrane capacitance and cytoplasmic conductivity. If you already use the Ampha Z40 for pollen, you will know how to go about measuring the viability of microspores isolated in one of our AmphaFluids. However, you can also measure microspores suspended in your isolation medium. Once you have your isolate, you shall mix a given volume of it with the AmphaFluid most suitable for your species of interest. Have a look at the Amphasys Pollen Analysis Instructions.
Adding the AmphaFluid is important to ensure that the conductivity of the medium is suitable to support the IFC measurement. The proportion of the mix needs to be found experimentally as each medium has specific physico-chemical properties: a suitable amount of AmphaFluid ranges usually between 50 and 80 percent of the final volume. However, I recommend getting in touch with the Amphasys Support Team when planning the experiment, so that we can advise you on the design, provide a suitable template and help you evaluate the results. Once you have prepared a homogeneous mix, filter it and pipette a precise volume in a FACS tube. Measure this sample using the counting mode. Make sure that the stop condition coincides with the volume you measure. Analyze the scatter plot by hiding debris if present (Figure 3). The results will show you the overall microspore concentration. Use a polygon or vertical gate, to obtain the number of viable cells. Now, to know how efficient your isolation method is, you just need to normalize them to the measured volume and, if needed, to the input material.
You can use this general approach to measure microspores viability and concentration every time you need, not just at the end of the isolation process. Being able to quickly verify microspores viability after the inductive treatment or throughout the culture period will allow you to take important decisions on the prosecution of the experiment in a timely manner and ultimately free up time to test even more conditions.

Figure 4: Scatterplot of pumpkin microspore isolate
Assessment of Inductive Treatment Success and Early Prediction of Embryo Yields
After the inductive treatment and once in culture, a large proportion of microspores will die or arrest their development within a few days. However, a fraction of the viable cells will start undergoing changes at many levels, first to form a multivacuolated star-like microspore and then dividing into a multicellular structure [3]. The evolution of microspores embryogenesis can be followed by IFC, as recently shown by scientists of the French research institute Vegenov [5].
They found that in wheat microspores these morphological and cytological changes are associated with modifications of the IFC signature. Through microscopic characterization of the morphology of microspores appearing upon the inductive treatment, they could associate the nature and abundance of a new population, absent before induction and referred to as P2, with star-like microspore. This is a structure common to many species when microspores become committed to embryogenesis [6]. The abundance of the population P2 right at the end of the inductive treatment was found to be a marker of the culture reactivity to embryogenesis. The implications of this finding are that even before starting the culturing process, you can determine whether the stress treatment was adequate to set the experiment for success, by inducing the initial cellular changes required for embryo formation.
Furthermore, one day into the culture process, yet another population appears. They defined this population P3. The amplitude and phase angle of P3 do not overlap with any of the populations found during gametophytic development, hence, they concluded, it consists of structures exclusive to the embryogenic pathway, such as multinuclear microspores. This population decreases in abundance as microspores die, from day one to day seven of culture. However, its median amplitude and phase increase, indicating continuous cellular changes.
A mathematical linear model was set up to predict embryo production based on IFC data. Statistical analysis shows that the best predictive value for embryo production after 30 days is the abundance of P3 seven days after the culture onset. This means that as early as on day seven of culture, the embryo yield can be predicted with a high statistical significance. The observations made with wheat microspores are likely to similarly apply to other species. This would mean being able to decide after just a few days whether it is worth keeping a culture or discarding it as it won’t produce embryos. How much time would you save from not having to analyze by microscopy your running cultures multiple times over weeks? And how much more space would you have in the incubators to test other conditions, such as the effect of different culture medium compositions, induction treatments, isolation methods or plant growth conditions?
I wonder if the analysis of ovules by IFC would bring the same benefits to the development of haploids via gynogenesis…
While writing this article it became even clearer to me that obtaining doubled haploid plants is a complex and lengthy process. It requires skills and experience. But also patience, perseverance and the hope that at some point all the factors playing into it will align in the best of their configuration and let the fascinating process of cell fate determination lead somewhere different than initially planned. It would be great to see this more often, enabled by new technologies like IFC.
If you plan to get started using our technology for your DH development projects and need help, or if you made some experiences and want to share them, get in touch with us at support@amphasys.com. We are happy to hear from you.
Federica
Subscribe to our blog!
We provide you with our latest research, insights and tips & tricks around pollen analysis.
Amphasys Pollen Analyzers
Amphasys Pollen Analyzers provide pollen quality metrics which enable you to improve your plant breeding and seed production processes:
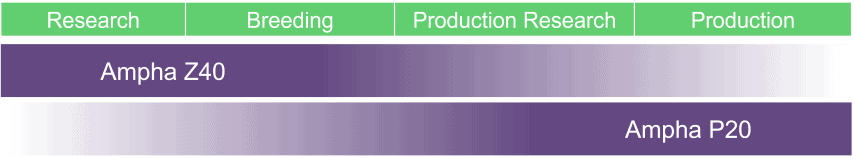
The Ampha Z40 is a high-end laboratory device. It offers full flexibility for all research tasks and predefined templates for routine quality control.
The Ampha P20 is a mobile high-tech instrument for greenhouses and fields. With its easy handling and automated data analysis you get immediate results on site.
Sources
This is a selection of the articles that guided my writing