
Quantifying Wheat Pollen Shed
Learn how to determine one of the key parameters in hybrid wheat seed production!
Introduction

Georg Roell
My name is Georg Roell, and I am part of the Amphasys support team. I have been working on wheat for more than 15 years. This includes working on a farm, in the breeding and plant protection areas and during my PhD studies. At all these different levels the main goal was to maximize yield by optimizing the management and/or the genetic material. Phenotyping of pollen characteristics can deliver a new tool to identify traits in plant breeding.
What this Article is About
In my previous blog post on “Measuring Wheat Pollen Viability,” I mainly focused on different pollen extraction methods for accurate and efficient pollen viability measurements in wheat.
Maybe you already asked yourself: “What about pollen quantity”?
Indeed, when it comes to hybrid wheat production, it is not only important to have pollen that is highly viable and maintains its viability as long as possible but also to have a high amount of pollen shed at just the right time point.
And that’s why I want to show you which methods for wheat pollen quantification we have tested in field experiments.

Previous Article

The Challenge in Wheat Pollen Quantification
Wheat is self-pollinated due to the flower architecture, which results in generally lower pollen production compared to other cereals [6].
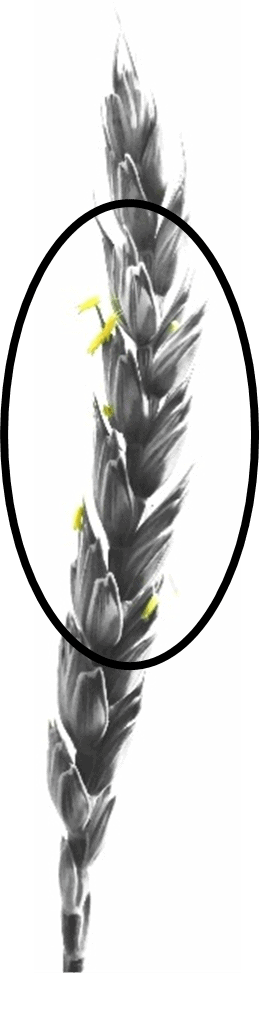
In hybrid wheat breeding, cross-pollination is the fundamental process that requires a male line producing a high quantity of pollen. For the selection of good male pollinator lines, cumbersome manual counting of extruded anthers is a common approach to have an estimate for line-specific pollen release [4].
Anther extrusion correlates with the seed set but it does not entirely explain the final seed set [1]. For example, it does not give us information about the total amount of pollen shed. This can lead to biased results if you perform the line selection based on anther extrusion.
Field studies showed different seed set despite similar anther extrusion [1]. A reason for this was mentioned by Pickett [5] who stated that the pollen amount shed is more important for seed set than extruded anthers in wheat. Having a reliable method for pollen collection and counting would ease the selection of male lines based on the pollen shed characteristics [3].
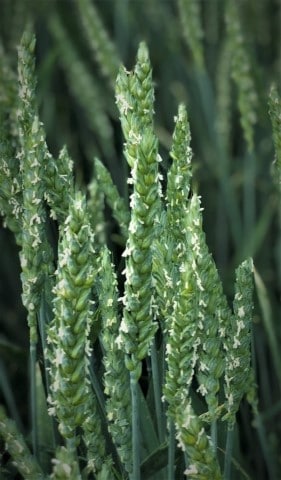
Wheat spike with anthers
Subscribe to our blog!
If you want to make sure to be informed about new articles, subscribe to our blog!
How Can a Pollen Quantification Method Look Like?
In my previous blog post I described that wheat pollen is very short-lived. The flowering starts in the middle part of the spike and continues towards the top and bottom. The pollen release of one spike takes normally around 5 – 6 days depending on the environmental conditions. This means in a practicable setup, viability and quantification cannot be performed at the same time on spike level. Therefore, viability tests and quantifications are usually performed separately. As pollen collection is not instantaneous, a suitable collection method must keep the pollen stable until analysis.
Therefore, we came up with two different potential pollen quantification methods which I want to present to you in this blog post: At first, I want to focus on the collection of pollen at spike level (requires pollen collection of one single spike) and secondly, I want to show you how to assess pollen dispersal in the field which can be used to get further information on how much pollen was travelling, how far and in which timeframe.
Wheat Pollen Analysis with the Ampha P20
Pollen Quantification on Spike Level
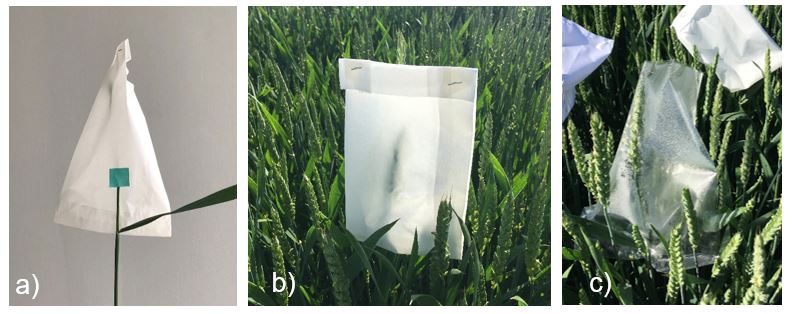
The simplest way to quantify the pollen shed by a spike is to encase wheat spike with a bag shortly before flowering starts. The bags have to be closed so that no pollen can escape during the flowering period. After the flowering is completed the bag is removed and the shed pollen can be quantified.
For our experiments we used ordinary paper and plastic bags, cutting a slit in the side for inserting the spike, as can be seen on picture a) below. After inserting the spike we closed the slit by attaching a small piece of tape to ensure no pollen gets lost. As shown in picture b), the top of the bag was then folded once and closed with a stapler when we performed this experiment in the field.
During the runtime of the experiment a strong condensation within the paper and plastic bags was observed. If you take a good look, you can even see the droplets in picture c).This led to pollen clumping and made the subsequent pollen retrieval difficult. In addition to condensation, we also observed static charge which made the removal of the pollen a difficult endeavor. Therefore we excluded plastic bags from our experiments.
Outdoor vs. Indoor Spike Bagging

Hence, we continued with the paper bags and searched for a possibility to minimize the condensation issue.
The solution was indoor shedding: Several spikes of different genotypes were collected in the field with the stem (cut close to the ground), put in a bucket of water, and bagged the same way as in the field trial. After collecting, the bagged spikes were transferred to our lab and sat there for seven days at around 22 °C for flowering. This method worked quite fine as the picture shows, no pollen clumps were observed, and the pollen could be fully removed from the paper bags.
After retrieving the pollen from the paper bags, it was suspended in the newly developed AmphaCount buffer for counting.
A defined aliquot was taken from the pollen suspension and measured using the Ampha P20 Pollen Analyzer.
Now I am sure, you are eager to see the results we have achieved…
Wheat Pollen Quanitifaction Per Spike
The results of the bagging experiment in the lab show differences between varieties in the amount of pollen grains per spike. Variety 5, for example, released more than three times the amount of pollen shed by Variety 1.
It is really impressive how big the differences between varieties can be.

Watch our Wheat Webinar
If you have missed our Virtual Amphacademy, watch the recording of the session now!


As this picture illustrates, differences between spikes within the same varieties were observed. This shows the importance of collecting more than one spike for the comparison of line-specific pollen shed characteristics.
Please keep in mind that if you want to determine how many pollen grains are released by a genotype (which is crucial for hybrid breeding), a normalization for comparison is necessary. Different lines can have different numbers of spikelets per spike or tillers per land area. Therefore, normalization can be pollen per spikelet, which requires spikelet counting and dividing the pollen amount by the number of spikelets. Another method that is mainly useful for in field trials, where pollen per land area is determined. You just have to count the tillers per land area and multiply them by the average of the shed pollen per spike.
Pollen Dispersal Quanitifcation in the Field
Determining the amount of pollen from single spikes, spikelets, or land area does not give us the full picture of the pollen shed characteristics of different genotypes.
Comparing the results of the pollen bagging experiments with data from other cereals we realize that wheat produces only around 10% of the amount of pollen of rye and around 2.5% of the amount of corn [2]. In addition, wheat pollen is considered relatively heavy [3] which further affects the pollen dispersal and therefore the success of your hybrid wheat breeding program.
To create a low-cost hybrid seed production, a high pollen production, a wide range of pollen dispersal, and a synchronous flowering period of male and female plants are required.

Liquid Pollen Trap
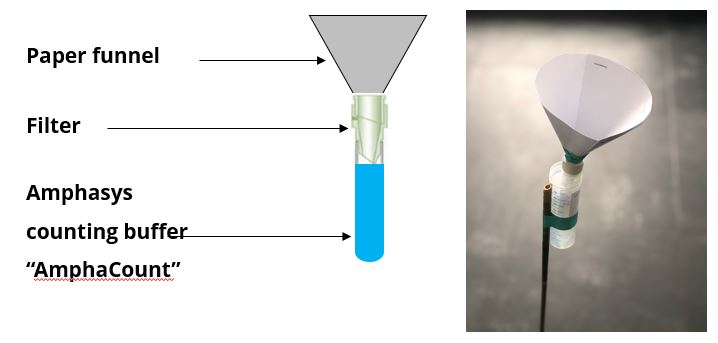
To test the pollen dispersal in the field, a so-called “liquid pollen trap” prototype was created and tested under field conditions. The liquid pollen trap consisted of a round bottom tube, filled with AmphaCount buffer, an assembly of filter (preventing insects and large particles from falling in the liquid), and a paper funnel to collect the airborne pollen.
The whole assembly was then attached to a stick and placed in the field, with the opening of the funnel slightly below the spike level.
The experiment was performed by putting 24 liquid pollen traps in the field and regularly replacing (two-hour interval) the counting buffer in the round bottom tube throughout one day. An aliquot of the removed counting buffer was then directly measured with the AmphaZ32 Pollen Analyzer. In order to determine the pollen shed per land area, we calculated the total pollen number in the trap and scaled it with the surface area of the paper funnels obtaining the pollen per area.
Pollen Shed Dynamics
This trial setup gave us the possibility to capture the cumulative pollen shed dynamics from the morning to the evening. As you can see in the graph below, the results show a monotonous increase. This proves that pollen shed occurred throughout the whole day and that in the two-hour period between 3:30 pm and 5:30 pm more pollen was released. One explanation for this observation at the last timepoint, was the increase of windspeed due to an approaching thunderstorm.
Watch our Wheat Webinar
If you have missed our Virtual Amphacademy, watch the recording of the session now!

Improving the Trap Design
In a second pollen trap experiment, we kept the traps a couple of days in the field to examine the pollen shed characteristics over a longer time span without removing the buffer. One issue that occurred was the dew condensation (similar to the condensation issues with the bags) on the paper funnel. This led to sticking of pollen to the funnel walls and created clumps which biased the pollen shed quantification.
Searching for a more suitable liquid pollen trap capable of overcoming the condensation issue for long-term pollen collection, we developed a plastic pollen trap. A plastic cup with a larger diameter was designed to create an all-in-one design without a funnel. The filter of the previous design was replaced by an ordinary mosquito mesh to keep insects or larger dust particles from falling into the liquid.

This pollen trap design was further successfully tested in a series of corn experiments including a successful rain stability test. I do not want to spoil too much about this design and the experiments, because it will be the topic of a future blog post on corn pollen; so, stay tuned…
Take Home Message
Quantifying pollen shed is one of the key parameters for male line selection in hybrid wheat seed production. Pollen information based on in-field observation is therefore essential. It can be collected via spike bagging (quantifies the total amount of pollen released) or via liquid pollen traps (suitable for characterization of pollen shed dynamics).
Paper bags for pollen collection in the field are affected by dew condensation which can lead to pollen clumps and difficulties in pollen counting. I recommend some pretests at your location to validate if dew condensation is an issue. Using this method indoor and suspending the pollen in the AmphaCount buffer for counting showed good results. While this method is used for comparing the pollen production of different lines, a normalization (pollen production per land area or pollen per spikelet) is necessary for comparison. If you are interested in pollen production per land area, the tillers per unit land area have to be counted. The same concept has to be applied for pollen production per spikelet, which make the determination of spikelets per spike mandatory.
Another goal in quantifying the pollen shed characteristics is the determination of how much pollen is shed in which timeframe. This also involves for how long the pollen shed occurs and at what timepoint peak pollen shed is reached to synchronize female and male line. The concept of the liquid pollen trap was successfully tested, and a modified trap design was developed, this will be presented in more detail in a future post.

Pollen quantification method
Weather dependency
Information on pollen shed dynamics
My recommendation
Spike bagging outdoor
high
low
requires pretests at your location
Spike bagging indoor
low
low
yes
Liquid pollen traps
low
high
yes
If you are further interested in pollen analysis, sampling or quantification, stay tuned for the next posts or contact me directly.
Best Georg
Subscribe to our blog!
We provide you with our latest research, insights and tips & tricks around pollen analysis.
You can easily unsubscribe if you no longer wish to receive the updates.
Related Articles
Watch our Wheat Webinar
If you have missed our Virtual Amphacademy, watch the recording of the session now!
