
Basics of Impedance Flow Cytometry
In Impedance Flow Cytometry, we suspend cells in a fluid, and then pump them through a highly sensitive microchip. In the microchip, the cells travel along a micro-channel (imagine yourself walking through a tunnel), and exactly in the middle of the channel they are exposed to an electric field. The passage of each cell disturbs that electric field in a characteristic manner. That allows the cytometer to extract an impedance signature from every cell. As viable and dead pollen cells have different electrical properties, we can easily distinguish them. And all at a tremendous rate of up to 1’000 cells per second.
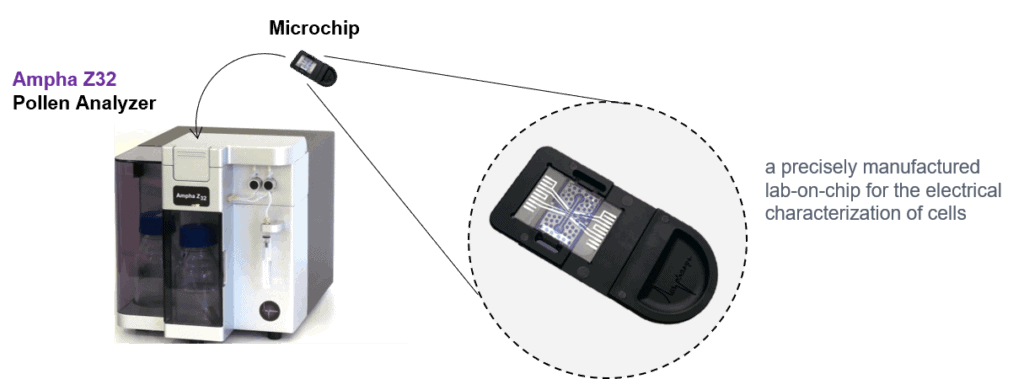
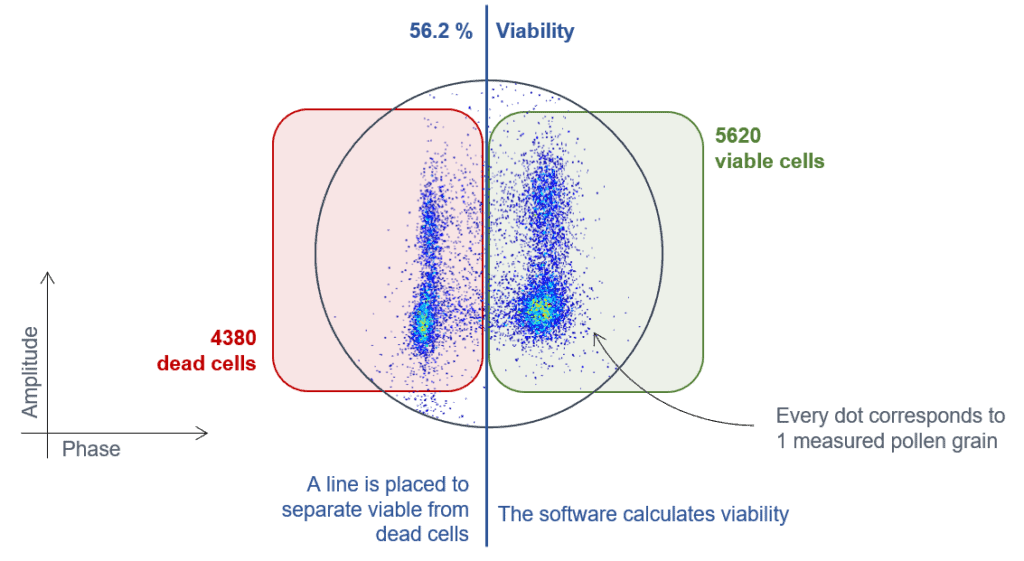
Within a few seconds the Pollen Analyzer acquires the electric signatures of 10’000 cells. The results are then displayed in so-called phase / amplitude scatterplots on a laptop.
The phase axis (x-axis) is our viability axis. The amplitude axis (y-axis) reflects the size of the cell and its position in the microchannel. Every measured pollen grain results in one dot in the scatter plot. Clusters of thousands of cells (dots) are formed during a measurement. The number of dots in those clusters can be quantified using simple so-called gating tools. That’s how you get your pollen viability.
Do you want to know more?
If you want more information about the science and technology behind impedance flow cytometry, drop us a line.
Let's stay in touch!
Subscribe to our blog!
We provide you with our latest research, insights and tips & tricks around pollen analysis.
You can easily unsubscribe if you no longer wish to receive the updates.